

SQL Chart Builder
<p>Screenshot 1</p>
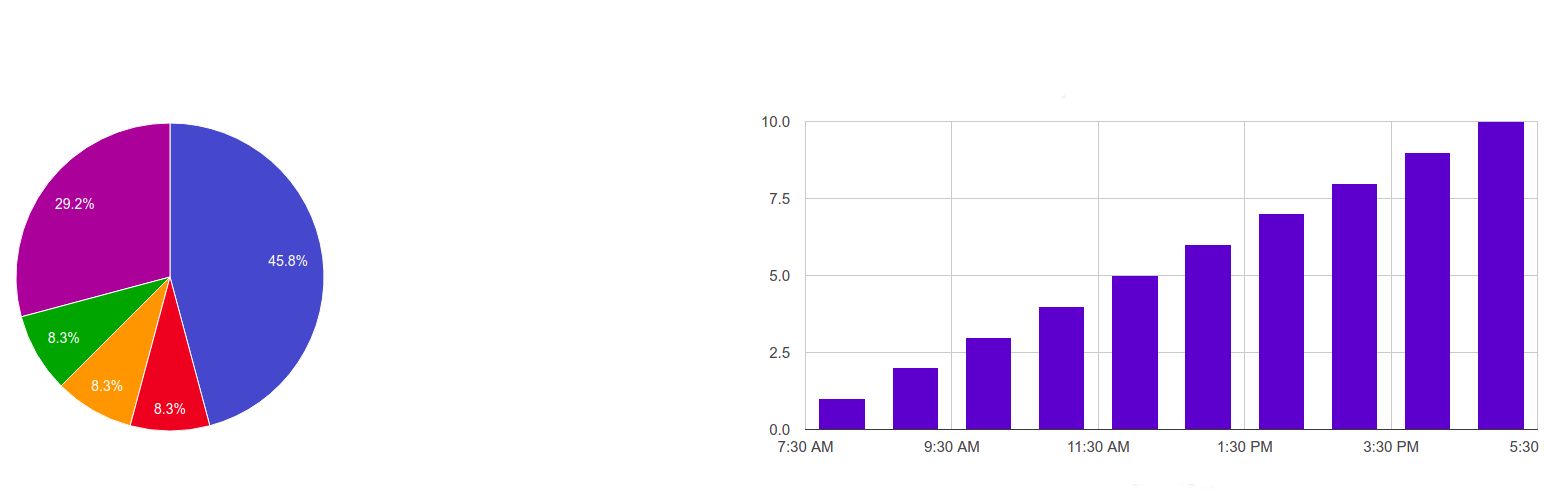
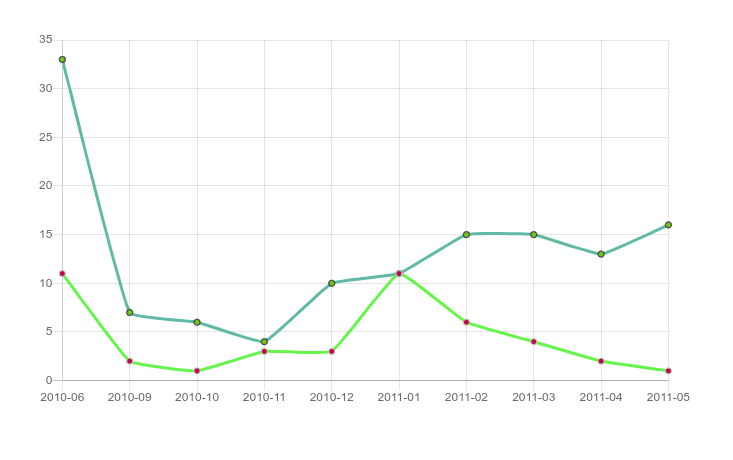
The plugin creates beautiful charts based on your SQL queries, then you can use those charts in any part of your website.
You can use both native wp and non-wp mysql tables in your queries.
11 chart types: Pie, Doughnut, Polar Area, Radar, Line, Area, Stepped Line, Bar, Horizontal Bar, Stacked Bar, Scatter
What’s new in 3.0
- A completely redesigned chart builder. No more “nerd-only” settings page: a clean, tabbed UI walks you through Chart & Data Dynamic Filters Style Advanced.
- Visual chart type picker with built-in guides. Every chart type shows a short “when to use it” guide plus a working example query you can insert with one click.
- Live SQL autocomplete. Start typing and the editor suggests SQL keywords (type “S” — get SELECT), your real database table names and real column names. Type
tablename.to see that table’s columns. Press Ctrl+Space for suggestions at any time. - Click-to-build query toolbar. SELECT / COUNT(*) / FROM / WHERE / GROUP BY / ORDER BY / LIMIT buttons plus “Insert table”, “Insert column” and “Insert dynamic tag” dropdowns filled with your actual database schema — build a best-practice query without typing a single word.
- No-code input filters. Add date/number/text filters as simple rows (tag, type, label, default) — the tag dropdown suggests
{tags}already used in your query and columns from its WHERE part. No more memorizing the~/|syntax (a raw editor is still available for pros). One click inserts the{tag}into your query. - Dropdown column mapping. The X/Y axis fields are dropdowns filled with the columns detected in your SQL query — no more guessing column names.
- Color pickers instead of typing hex codes, and a fixed professional default palette instead of random colors.
- Latest Chart.js v4, bundled inside the plugin — no third-party CDN calls, GDPR-friendly.
- 4 new chart types: Radar, Stepped Line, Stacked Bar and Scatter.
- Better front-end design: modern table view, restyled filter form and datepicker.
- Full legacy support: charts created with 2.x keep working unchanged. Deprecated Google-Chart types are automatically mapped to modern equivalents when you open/save the chart.
How to use
-
Go to Dashboard My SQL Charts Add New and give any name to your report.
-
Pick a chart type — read the short guide shown under the type cards, or click “Use this example” to start from a working query.
-
Build your SQL query with the toolbar buttons and autocomplete (real table and column names are suggested), then map the X and Y columns.
-
You can use multiple SQL queries too — just split them with the “;” sign to get comparison charts. You can also pass shortcode arguments into the query: with “select * from wp_posts where ID>{arg1}” the shortcode [gvn_schart_2 id=”2″ arg1=”11″] passes the value in (the builder’s live preview runs without arguments, so test such charts on a page).
-
After Publish/Update you will see the shortcode below the builder. Use it anywhere on your website: pages, posts, widgets, or the “My SQL Charts” Gutenberg block.
-
Check “Show table-view data below the graph” to also render the data as a styled table.
-
In the Input Filters tab, add filters by clicking “+ Add filter” — each one becomes an input (with a datepicker for date types) above the chart at the front-end.
Chart type mini-guide
- Pie / Doughnut — how a total splits into a few parts. One query: label column + numeric column.
- Polar Area — like a pie, but the value controls the radius; great for cyclic data (months, weekdays).
- Radar — compare one or more series across categories arranged in a circle (profiles, ratings).
- Line — trends over time; add more “;”-separated queries for comparison lines.
- Area — a line with the region filled; emphasizes volume.
- Stepped Line — values that change at discrete moments (prices, stock levels).
- Bar / Horizontal Bar — compare categories; horizontal is best for long labels.
- Stacked Bar — how each category total is composed; each “;”-separated query becomes one segment.
- Scatter — correlation between two numeric columns (both X and Y must be numeric).
Input filters (dynamic variables)
Use the visual rows in the Input Filters tab, or the raw format:
variable_name~default_value~variable_label~variable_type | variable_name~default_value~variable_label~variable_type
- variable_name – any single name you want.
- default_value – default value when no variable is chosen by the user
- variable_label – label visible on the form above the chart
- variable_type – number, text or date
- ~ separates variable elements, | separates variables
Example: with the filters “limit_tag~10~Count~number | post_date_tag~2010-07-05~Date Published~date”
you can use “select * from wp_posts where post_date<{post_date_tag} limit {limit_tag}” as the SQL code —
the plugin renders the corresponding inputs above the chart automatically.
Supported built-in dynamic tags: {current_user_id}, {current_user_login}, {current_user_email}, {current_user_display_name}.
Caching
Use [gvn_schart_2_cached id=”1″ expire=”3600″] to cache the rendered chart in a transient. Add &force_sql_cache_reload=1 to the URL to bypass it once (e.g. right after upgrading).
Website
https://guaven.com/my-sql-charts/
Documentation
https://guaven.com/my-sql-charts/#docs
Bug Submission and Forum Support
Please Vote if you liked our plugin
Your votes really help us. Thanks.
Available Filters
apply_filters( ‘guaven_sqlcharts_table_empty_cell’);
apply_filters(‘guaven_sqlcharts_pre_print_vars’);
apply_filters( ‘guaven_sqlcharts_final_output’);
apply_filters(‘guaven_sqlcharts_rendered_sql’);