

LMN Site Monitor
0/5 (0 ratings) 10 active installs Updated Oct 9, 2026
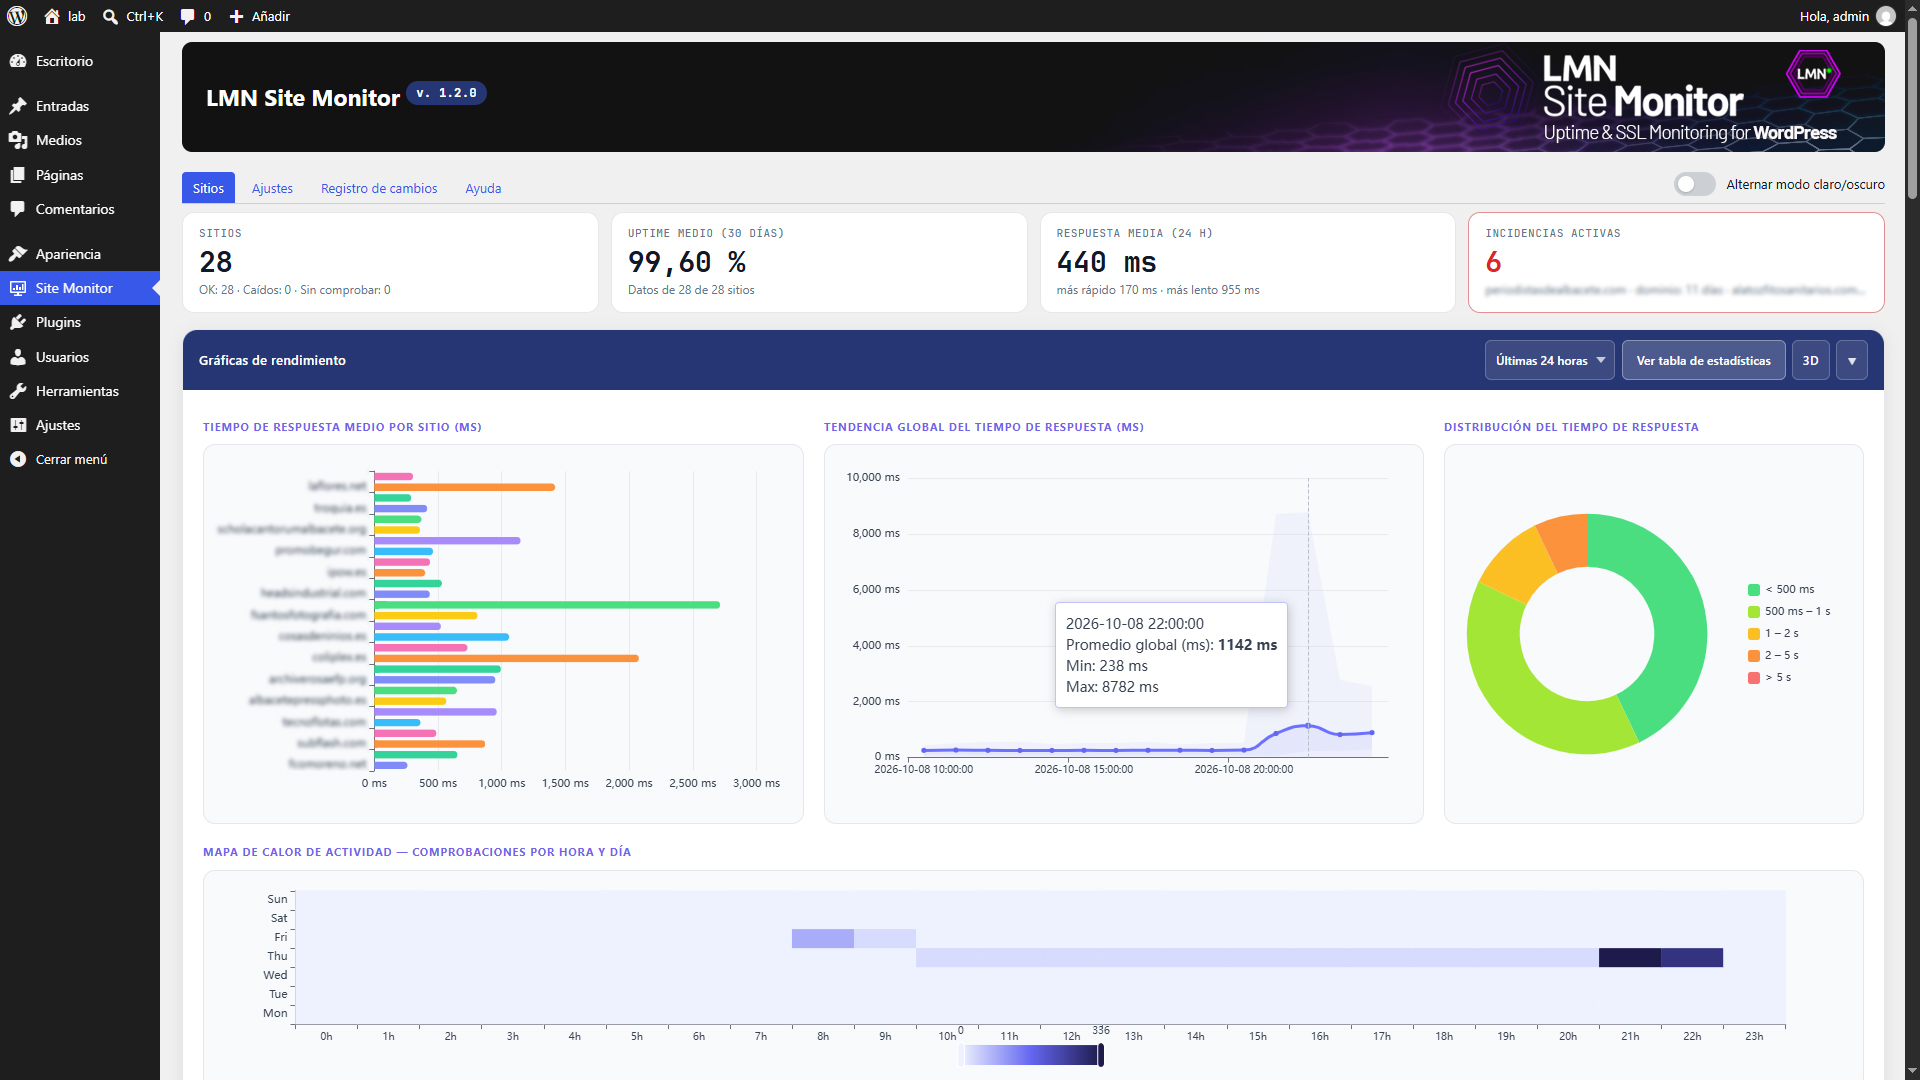
Main dashboard with ECharts performance charts: bar (2D/3D toggle), line (min/avg/max trend), and donut (speed tier distribution).
LMN Site Monitor watches your websites from the WordPress dashboard and alerts you when something goes wrong. No external SaaS and no account needed.
- Uptime checks (HTTP/HTTPS) with automatic retry to avoid false positives.
- SSL certificate and domain expiry warnings.
- Malware and phishing scans with Google Safe Browsing, URLhaus, VirusTotal and PhishTank, on demand or scheduled, with a PDF report.
- Response-time history, 90-day availability bars, self-hosted ECharts graphs and a statistics table (CSV/PDF).
- Alerts by email (HTML, dark mode), Telegram and Discord.
- Dashboard widget, CSV import/export and encrypted credentials.
- 16 languages: en, es, ca, gl, eu, fr, de, it, nl, pt, ar, tr, uk, ja, ko, zh.
More at lumina.fmkr.net/site-monitor.
External services
Only the first three are used without setup; the rest run once enabled in Settings.
- Monitored sites: an HTTP request on each check.
- WHOIS servers (each TLD registry): the domain name, daily and on WHOIS/DNS.
- WordPress.com mShots: your browser loads each site’s screenshot. Terms, Privacy
- Google Safe Browsing: the site URL, per scan. Terms, Privacy
- URLhaus: the site URL, per scan. Terms, Privacy
- VirusTotal: looks up the site URL per scan, never submits it. Terms, Privacy
- PhishTank (off by default): the site URL, per scan. Terms, Privacy
- Telegram / Discord: alert text (site, URL, status). Telegram Terms, Privacy; Discord Terms, Privacy
- Your SMTP server: alert emails.